Introduction
In this tutorial, we’ll build a real-time color monitoring system:
- Hardware: APDS-9960 color sensor connected to a CircuitPython-capable board.
- CircuitPython: Script to connect to Wi-Fi, read RGB values, and publish JSON payloads to the
sensors/colorMQTT topic. - macOS SwiftUI App: Subscribe to
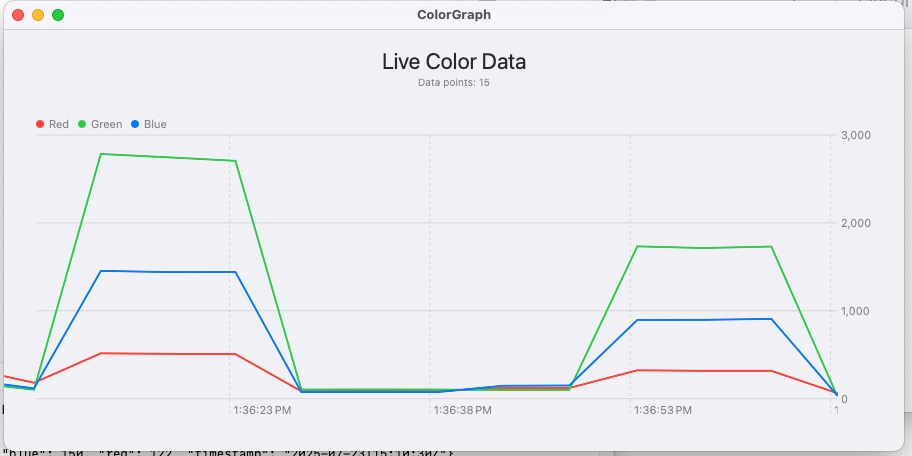
sensors/color, decode incoming data, and render a live updating chart.
All source code is available on GitHub: cerkit/ColorGraphApp.
Prerequisites
-
Hardware
- CircuitPython board (e.g., Raspberry Pi Pico W))
- APDS-9960 color sensor breakout
- Jumper wires (I’m using STEMMA QT Version)
-
Software
- CircuitPython 8.x installed on your board
- Access to an MQTT broker (e.g., Mosquitto on
raspberrypi.local) - macOS 14 / Xcode 15 with Swift Charts and MQTTNIO
Hardware Setup
-
Wire the APDS-9960 (or use STEMMA connections)
- VCC → 3V
- GND → GND
- SDA → GP4
- SCL → GP5
-
Install CircuitPython libraries
Copy the following to/libon CIRCUITPY:adafruit_apds9960adafruit_minimqttadafruit_requestsadafruit_bus_device
CircuitPython Publisher Script
Save as code.py on CIRCUITPY:
import time
import board
import busio
import wifi
import socketpool
import ssl
import adafruit_minimqtt.adafruit_minimqtt as MQTT
import adafruit_requests
from adafruit_apds9960.apds9960 import APDS9960
import json
import os
import supervisor

# Wi-Fi
WIFI_SSID = os.getenv("CIRCUITPY_WIFI_SSID")
WIFI_PASSWORD = os.getenv("CIRCUITPY_WIFI_PASSWORD")

# MQTT
MQTT_BROKER = "raspberrypi.local"
MQTT_PORT = 1883
MQTT_TOPIC = "sensors/color"

# I2C setup
i2c = busio.I2C(scl=board.GP5, sda=board.GP4)
apds = APDS9960(i2c)
apds.enable_color = True

# Connect to Wi-Fi
print("Connecting to Wi-Fi...")
wifi.radio.connect(WIFI_SSID, WIFI_PASSWORD)
print("Connected, IP:", wifi.radio.ipv4_address)

# Setup MQTT
pool = socketpool.SocketPool(wifi.radio)
mqtt_client = MQTT.MQTT(
    broker=MQTT_BROKER,
    port=MQTT_PORT,
    socket_pool=pool,
)

def connect_mqtt():
    try:
        mqtt_client.connect()
        print("MQTT connected.")
    except Exception as e:
        print("MQTT connection failed:", e)
        supervisor.reload()

connect_mqtt()

# Simulate time base
base_struct_time = time.struct_time((2025,7,23,13,30,0,0,0,0))
current_epoch = time.mktime(base_struct_time)
last_tick = time.monotonic()

def get_iso_time():
    t = time.localtime(current_epoch)
    return "{:04}-{:02}-{:02}T{:02}:{:02}:{:02}Z".format(
        t.tm_year, t.tm_mon, t.tm_mday, t.tm_hour, t.tm_min, t.tm_sec
    )

# Main loop
while True:
    now = time.monotonic()
    if now - last_tick >= 5:
        current_epoch += 5
        last_tick = now

    while not apds.color_data_ready:
        time.sleep(0.005)
    r, g, b, _ = apds.color_data

    payload = {
        "timestamp": get_iso_time(),
        "red": r,
        "green": g,
        "blue": b
    }
    mqtt_client.publish(MQTT_TOPIC, json.dumps(payload))
    print("Published:", payload)
    time.sleep(5)
macOS SwiftUI Subscriber
Clone the repo and open ColorGraph.xcodeproj:
- Add MQTTNIO: File → Add Packages… →
https://github.com/adam-fowler/mqtt-nio.git - ContentView.swift: Use:
import SwiftUI
import Charts

struct ContentView: View {
  @EnvironmentObject var mqtt: MQTTService
  let window: TimeInterval = 60

  var body: some View {
    VStack {
      Text("Live Color Data").font(.title)

      if mqtt.incomingData.isEmpty {
        Text("Waiting for data…")
      } else {
        let end = mqtt.incomingData.last!.timestamp
        let start = end.addingTimeInterval(-window)

        Chart {
          ForEach(mqtt.incomingData) { p in
            LineMark(x: .value("Time", p.timestamp),
                     y: .value("Value", Double(p.red)))
              .foregroundStyle(by: .value("Channel", "Red"))
            LineMark(x: .value("Time", p.timestamp),
                     y: .value("Value", Double(p.green)))
              .foregroundStyle(by: .value("Channel", "Green"))
            LineMark(x: .value("Time", p.timestamp),
                     y: .value("Value", Double(p.blue)))
              .foregroundStyle(by: .value("Channel", "Blue"))
          }
        }
        .chartForegroundStyleScale(["Red": .red,
                                   "Green": .green,
                                   "Blue": .blue])
        .chartLegend(position: .top)
        .chartLegend(.visible)
        .chartXScale(domain: start...end)
        .frame(height: 300)
        .padding()
      }
    }
    .padding()
    .task { await mqtt.connect() }
  }
}
Conclusion
You now have a full pipeline:
- APDS-9960 reads color
- CircuitPython publishes MQTT JSON
- SwiftUI macOS app renders live chart